2 Years Into NEM 3.0: What California Solar Bills Actually Look Like in 2026
The week NEM 3.0 went live in April 2023, my phone didn't stop ringing. Contractors I'd been supplying panels and inverters to for years were calling — not to place orders, but to vent. One installer in Riverside told me he'd had three signed contracts cancel in the same week. Another in Fresno said a customer literally asked him, "So solar is basically dead now, right?"
I didn't have a clean answer for them then. Now, two years in, I do.
I've spent the last several months going through real utility bills from homeowners across PG&E, SCE, and SDG&E territories — people who installed solar before and after NEM 3.0 went live. Some are doing significantly better than they expected. Some are seeing barely any savings. And the difference almost always comes down to one thing: whether they have a battery and how they use it.
This isn't a prediction piece. These are actual NEM 3.0 California solar bills from 2026 — real numbers from real homeowners. Here's what NEM 3.0 has done to solar economics — and what it means if you're deciding whether to go solar today.
Quick Answer
Two years into NEM 3.0, California solar homeowners without a battery are saving an average of $80–$150/month — about half of what NEM 2.0 customers saved under similar setups.

Homeowners with a battery and smart TOU (time-of-use) scheduling are saving $150–$300/month, with payback periods of 7–9 years. The gap between these two groups is the story of NEM 3.0 California solar bills in 2026.
Table of Contents
What NEM 3.0 Actually Changed (And What It Didn't)
Solar-Only Bills Under NEM 3.0: The Real Numbers
Solar + Battery Bills: What the Numbers Show
The Biggest Variable: Where Your Power Goes During the Day
By Utility: How NEM 3.0 California Solar Bills Differ Across PG&E, SCE, and SDG&E
NEM 2.0 vs. NEM 3.0 Bill Outcomes: 2026 Snapshot
Three Real Scenarios: Where Do You Fall?
What the SGIP Rebate Still Does for 2026 Buyers
What to Do If You're Deciding Right Now
FAQ
Conclusion
Related Posts
What NEM 3.0 Actually Changed (And What It Didn't)
Before getting into the bill numbers, it helps to understand exactly what shifted — because a lot of homeowners still aren't clear on this.
Under NEM 2.0, every kilowatt-hour your panels sent to the grid earned you a credit at roughly the full retail rate — 30 to 40 cents per kWh depending on your utility. That made oversizing your system a smart move: send more to the grid, earn more credits, use them later. A well-designed 8 kW system in PG&E territory could realistically pay off in 5 to 6 years.
NEM 3.0, officially called the Net Billing Tariff (NBT) under CPUC Decision 22-12-056, changed that one rule — but it changed everything downstream. Export credits dropped to "avoided cost" pricing, which varies by hour based on what the grid actually needs. In practical terms, daytime exports now earn 2 to 8 cents per kWh. That's a 75 to 80% pay cut for the power your panels produce during peak sun hours.
What didn't change: the cost of power you buy from the grid. SCE's TOU-D-PRIME still charges roughly 59 cents per kWh during the 4–9 p.m. peak window in summer. PG&E's EV2-A hits 54 cents during the same window. SDG&E's EV-TOU-5 goes as high as 80 cents.
So the math shifted dramatically. Before, you'd export at 35 cents and import at 35 cents — a wash. Now you export at 5 cents and import at 50 cents. Every kWh you send to the grid instead of using yourself costs you roughly 45 cents in lost value.
A California appellate court upheld NEM 3.0 in March 2026, so this structure isn't going anywhere. These are the rules homeowners need to design around.
Solar-Only Bills Under NEM 3.0: The Real Numbers
Let me walk through what solar-only customers are actually seeing on their NEM 3.0 California solar bills two years in.
Typical profile: SCE territory, 3-bedroom home, 8 kW system, no battery
Before solar, this homeowner was paying around $280/month on SCE's TOU-D-PRIME rate — roughly $3,360 per year. After installing an 8 kW system in mid-2023 under NEM 3.0, here's what happened:
Months 1–3 (fall/winter): Bill dropped to around $60–$80/month. Panels are producing less, so more self-consumption and fewer exports. The math actually works fairly well.
Months 4–6 (spring): Bill drops to $20–$40/month. Great production, but the household leaves for work at 7 a.m. and comes home at 6 p.m. A lot of that midday power is going to the grid at 5 cents.
Months 7–9 (summer peak): Bill rises back to $120–$160/month. The panels are producing well, but the 4–9 p.m. peak window — when the household uses A/C, appliances, and cooking — is drawing straight from the grid at 59 cents.
Annual savings: roughly $1,200–$1,500, or about $100–$125/month average. Compare that to the $2,000–$2,400 this same setup would have saved under NEM 2.0.
Why the summer bills are so painful: under NEM 2.0, you'd bank credits during the day and use them in the evening. Under NEM 3.0, you export your daytime kWh at 5 cents, then buy back evening kWh at 59 cents. Each kWh you shift that way costs you 54 cents in round-trip losses. A household using 20 kWh between 4–9 p.m. on a summer day is spending $11.80 on peak power that their panels technically "produced" — they just produced it at the wrong time.
For a full breakdown of how to calculate your actual payback period under these conditions, see our step-by-step guide to Solar Payback Period California 2026.
Solar + Battery Bills: What the Numbers Show
The battery changes the math significantly — but only if it's set up correctly.
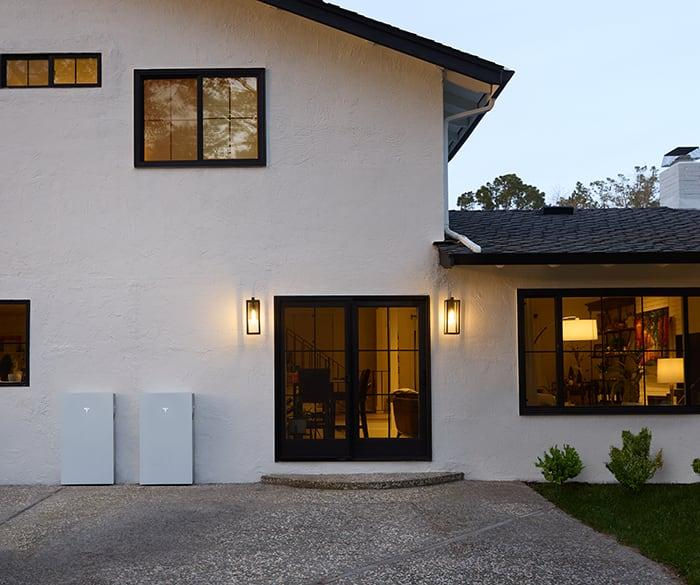
Typical profile: PG&E territory, 4-bedroom home, 9 kW system + Tesla Powerwall 3 (13.5 kWh), TOU scheduling enabled
Before solar, this household was paying around $350/month on PG&E's EV2-A rate. After installing in early 2024 under NEM 3.0:
The Powerwall charges from solar production between 10 a.m. and 3 p.m., when the system is producing its peak output.
Between 4–9 p.m., the battery discharges instead of drawing from the grid at 54 cents.
Any remaining excess production exports to the grid for 5–8 cents, but this household has almost no excess — they're using roughly 85% of what they produce on-site.
Monthly bill in summer: $40–$70. Monthly bill in winter: $60–$100. Annual savings: roughly $2,500–$3,200.
That's a meaningful number. The system cost roughly $42,000 installed (9 kW + Powerwall 3, full permitting, PG&E interconnection). Without the 30% federal ITC — which expired December 31, 2025 — the payback period is approximately 8 years. That's longer than the NEM 2.0 era, but still reasonable for a system that should produce for 25+ years.
The critical variable: TOU scheduling. Homeowners who installed a battery but never configured the peak discharge window are leaving significant money on the table. If the battery is set to "self-powered" mode without a TOU override, it may discharge during the day when rates are low, instead of holding charge for the 4–9 p.m. window. This single setting can be worth $300–$600 per year in bill differences.
For a detailed breakdown of what batteries cost and which models are common in California installs right now, see our guide to Solar Battery Costs in California 2026.
The Biggest Variable: Where Your Power Goes During the Day
Here's the thing NEM 3.0 exposed that NEM 2.0 largely masked: your daily usage pattern matters more than your system size.
Two homes with identical 8 kW systems will have completely different NEM 3.0 California solar bills depending on when they use power:
Home A — Work-from-home household:
Uses washer, dryer, dishwasher, A/C, and devices throughout the day. Self-consumption rate: 70–80%. Under NEM 3.0 without a battery, this household is still capturing most of their solar value. Bill savings: $150–$200/month.
Home B — Both adults leave at 7 a.m., return at 6 p.m.:
Uses almost no power during peak solar hours. Self-consumption rate: 20–30%. Exports most production at 5 cents, buys back expensive evening power. Bill savings without a battery: $60–$90/month. The same panels, dramatically different results.
This is why the first question any honest NEM 3.0 installer should ask you is: what does your daily schedule look like? If you can shift dishwasher cycles, laundry, and EV charging to 10 a.m.–3 p.m. — even occasionally — you recover meaningful value without a battery. Smart plugs and automated schedules cost $50–$200 and can shift 3–5 kWh of load per day into the solar window.
But for most working families who can't be home during peak production hours, a battery isn't optional under NEM 3.0. It's the mechanism that captures value you'd otherwise give away for 5 cents.
By Utility: How NEM 3.0 California Solar Bills Differ Across PG&E, SCE, and SDG&E
The same solar system produces different savings depending on which utility you're on, because the peak/off-peak spread varies significantly.
SDG&E customers have the strongest case for batteries — and the clearest NEM 3.0 pain without one. The EV-TOU-5 rate hits 80 cents/kWh during peak hours in summer, while super off-peak rates drop to 12 cents. That's a 68-cent spread. Every kWh shifted from peak to off-peak through battery storage is worth 68 cents. A 13.5 kWh battery fully cycled every day generates roughly $3,400/year in rate arbitrage value in SDG&E territory before considering self-consumption savings.
SCE customers on TOU-D-PRIME see peak rates around 59 cents and off-peak around 26 cents — a 33-cent spread. A battery cycling daily in SCE territory generates roughly $1,600–$2,000/year in arbitrage, on top of self-consumption savings.
PG&E customers on EV2-A see peak rates around 54 cents and off-peak around 23–33 cents. The math is similar to SCE, with annual battery arbitrage value in the $1,400–$1,800 range.
LADWP customers have a different situation entirely. LADWP uses a tiered rate structure without the same extreme peak pricing — standard residential rates run 22–28 cents/kWh. Batteries provide less financial benefit in pure arbitrage terms, though backup power and self-consumption savings still apply.
The practical takeaway: if you're on SDG&E, the financial case for adding a battery under NEM 3.0 is overwhelming. If you're on LADWP with a simpler rate structure, the payback math needs a closer look before you commit to the added cost.
For more on how California's rising utility rates are affecting the overall solar calculus, see our guide on Why Bills Keep Rising and How Solar Can Help (California Electricity Rates 2026).
NEM 2.0 vs. NEM 3.0 Bill Outcomes: 2026 Snapshot
Two years in, here's what the data shows across both rate structures for comparable homes:
Category | NEM 2.0 (grandfathered) | NEM 3.0, Solar Only | NEM 3.0, Solar + Battery |
Average monthly savings | $180–$250 | $80–$150 | $150–$300 |
Self-consumption needed | 40–50% | 40–50% | 80–90% |
Export credit value | 30–40¢/kWh | 2–8¢/kWh | Minimal (self-use) |
Payback period | 5–7 years | 10–14 years | 7–9 years |
25-year projected savings | $55k–$85k | $25k–$45k | $45k–$90k |
Rate hike protection | Moderate | Partial | High |
Backup during outages | No | No | Yes (10+ hrs) |
Figures based on 8–9 kW systems on SCE/PG&E TOU rates with average California home using 30–40 kWh/day. Individual results depend on usage patterns, roof orientation, and local rates.
The gap between NEM 3.0 solar-only and NEM 3.0 solar + battery is striking — and it's widening as utility rates continue to climb. Every rate hike increases the value of stored solar energy, because you're avoiding more expensive grid power. A battery that saved $2,500/year in 2024 may save $3,200/year by 2028 on the same usage pattern, assuming SCE and PG&E continue their historical 3–5% annual rate increases.
If you're still on NEM 2.0 and wondering what happens to your grandfathered rate, see our breakdown of NEM 1.0 or 2.0 in California? Here's What Happens to Your Solar Bills After July 2026.
Three Real Scenarios: Where Do You Fall?
Scenario 1: The Work-From-Home Household ($200–$250/month PG&E bill)
Profile: Two adults work remotely, use appliances throughout the day, have a heat pump system. 7 kW solar, no battery, installed 2024.
What they're seeing: Monthly bills of $30–$60 during spring/summer, $80–$100 in winter. Self-consumption rate around 65–75%. Annual savings: approximately $1,800–$2,200. System cost: roughly $22,000.
Payback: approximately 10–12 years without the federal ITC. A battery would shave this to 8–10 years and add backup power, but the solar-only economics are still reasonable because they're actually home to use what they produce.
Best move: Add a smart thermostat and automated appliance scheduling to push self-consumption closer to 80%. Consider a battery in years 3–5 if rates keep climbing.
Scenario 2: The Commuter Household ($300–$350/month SCE bill)
Profile: Both adults leave by 7:30 a.m., home by 6:30 p.m., two school-age kids. 8 kW solar, no battery, installed mid-2023.
What they're seeing: Monthly bills of $120–$170 in summer (A/C + peak evening usage), $60–$90 in winter. Self-consumption rate around 25–35%. Annual savings: roughly $1,200–$1,600. System cost: $24,000.
Payback: 15+ years — longer than most homeowners expected when they signed. This is exactly the household NEM 3.0 hits hardest.
Best move: Add a battery. A 13.5 kWh Enphase IQ 5P or Powerwall 3 would raise annual savings to $2,500–$3,200 by capturing midday solar for evening use. The battery adds roughly $12,000–$15,000 to the project cost, but drops payback from 15+ years to 9–11 years combined.
Scenario 3: The SDG&E Homeowner with EV ($400+/month bill)
Profile: One EV charging at home, SDG&E EV-TOU-5 rate, rates hitting 80 cents at peak. 9 kW solar + 13.5 kWh battery, installed 2024.
What they're seeing: Monthly bills of $40–$80 — down from $420/month. EV charges from stored solar overnight or during super off-peak hours at 12 cents. Self-consumption: 85%+. Annual savings: $3,500–$4,500. System cost: $46,000.
Payback: approximately 10–13 years — longer because SDG&E installs cost more and the ITC is gone, but the monthly savings are among the highest in California.
Best move: Stack SGIP battery rebates if eligible. SDG&E high-fire-risk zones and low-income households can still access meaningful SGIP incentives through cpuc.ca.gov, which shortens payback by 1–2 years.
For more on how solar interacts with EV charging costs, see our guide on Why Your EV Charging Cost Is So High in California 2026 (And 5 Ways to Fix It).
What the SGIP Rebate Still Does for 2026 Buyers
One program that's still alive and worth checking: the Self-Generation Incentive Program (SGIP). Two years into NEM 3.0, SGIP hasn't disappeared — but it's changed.
The standard residential battery rebate has been largely exhausted in many utility territories. What remains in 2026:
Equity Resiliency tier: Available to low-income households, customers in high-fire-threat districts (HFTD), or those on medical baseline. This tier provides the highest rebate per kWh — sometimes covering 50–75% of battery costs.
Equity tier: Available to income-qualified customers in disadvantaged communities. Smaller rebate than Equity Resiliency, but still meaningful.
Standard tier: Largely subscribed in most territories. Check cpuc.ca.gov for current waitlist status before assuming you'll qualify.
If you're in a high-fire-risk area — parts of the East Bay hills, Santa Cruz Mountains, Southern California foothills — the Equity Resiliency SGIP rebate combined with NEM 3.0 battery economics makes a compelling financial case. Some homeowners in these zones are seeing effective battery costs of $4,000–$7,000 after SGIP, dramatically improving their payback.
For a full breakdown of how to combine SGIP and NEM 3.0 incentives, see our guide on SGIP Battery Rebate + NEM 3.0 in California: The 2026 Guide to Stacking Incentives.
What to Do If You're Deciding Right Now
If you're sitting on a proposal and trying to figure out whether 2026 solar makes sense for your home, here's the most honest framework I can give you — based on two years of watching real NEM 3.0 California solar bills:
Step 1: Get a load profile before anything else.
Ask any installer you're considering to show you a 24-hour usage breakdown of your home — when you use power and how much. If they can't or won't do this, that's a red flag. No system design makes sense without knowing when your household actually needs electricity. This is the single most important step that separates a system that performs from one that disappoints.
Step 2: Match the proposal to your usage pattern.
If you're away during the day, any solar-only proposal should come with a clear explanation of why a battery isn't being recommended. If the answer is "it's too expensive," ask them to show you the payback comparison both ways. The delta is often smaller than expected once you factor in the bill savings from peak-hour avoidance.
Step 3: Get three bids from C-10 licensed contractors with NEM 3.0 experience.
Verify licenses at cslb.ca.gov. Specifically ask each contractor: how many NEM 3.0 systems have you installed in my utility territory, and what are customers reporting on their bills? A contractor who has done 50+ NEM 3.0 installations in SCE territory will give you much better guidance than one who's still designing systems the way they did in 2021.
NEM 3.0 made solar harder to optimize — but it didn't make it a bad investment. The homeowners doing best are the ones who designed around the new rules instead of hoping the old math still applies.
NEM 3.0 Two-Year Bill FAQ
Q: Are people actually saving money on their NEM 3.0 California solar bills in 2026?
A: Yes — but the savings are more uneven than under NEM 2.0. Homeowners with batteries and high self-consumption are saving $150–$300/month. Solar-only customers who are home during the day are saving $100–$180/month. Solar-only customers who are away during peak production hours are often saving just $60–$100/month, which can feel disappointing compared to what they were promised.
Q: How long is the payback period for solar in California without the federal tax credit in 2026?
A: Solar-only systems typically pay back in 10–14 years under NEM 3.0 without the 30% ITC, which expired December 31, 2025. Solar + battery systems typically pay back in 7–9 years for most California households. These ranges assume standard utility TOU rates and average sun exposure for each territory.
Q: I installed solar before NEM 3.0 — am I grandfathered?
A: Yes. Systems interconnected before April 15, 2023 on NEM 2.0 keep their original rate structure for 20 years from the interconnection date. If you're considering selling your home, your NEM 2.0 agreement may be transferable to the buyer — see our guide on Solar Home Sale in California (2026): Does Your NEM 1.0 or 2.0 Contract Transfer to the Buyer?.
Q: Can adding a battery to my NEM 2.0 system affect my grandfathered status?
A: In most cases, adding a battery to an existing NEM 2.0 system does not trigger a tariff change — you keep your NEM 2.0 rate. However, if you expand your solar capacity (add more panels), the entire system may need to be re-interconnected under NEM 3.0. Always confirm this with your installer and utility before making any modifications.
Q: My neighbor has solar and says their bill is nearly zero — is that still possible?
A: Possibly, but context matters. If they're on NEM 2.0, the math is different. If they're on NEM 3.0 with a large battery, work from home, and have shifted most loads to solar hours, it's achievable — but it requires a well-designed system and active energy management. "Nearly zero" bills under NEM 3.0 with solar-only and a standard commuter lifestyle are very rare.
Q: Is NEM 3.0 going to change anytime soon?
A: A California appellate court upheld NEM 3.0 as recently as March 2026. There are no active CPUC proceedings to reverse the structure. NEM 3.0 is the rate environment California solar buyers should plan around for the foreseeable future.
Q: What's the best battery for California homes under NEM 3.0 in 2026?
A: The most common choices in 2026 are the Tesla Powerwall 3 (13.5 kWh) and the Enphase IQ 5P (5 kWh per unit, typically installed in pairs or triples). Both use LFP (lithium iron phosphate) chemistry — safer, longer cycle life (6,000+ cycles), and rated for high-heat environments. For most 3–4 bedroom California homes, 10–13.5 kWh of storage is the practical minimum for meaningful peak-hour coverage.
For a full comparison, see our guide to Solar Battery Costs in California 2026.
Q: Are there still any incentives for solar in California in 2026?
A: The 30% federal ITC expired for residential installs at the end of 2025. SGIP remains available for batteries, primarily through Equity and Equity Resiliency tiers for qualifying households. Some local utilities and municipalities offer separate rebates — check with your installer and utility billing department for current programs in your area.
Conclusion
Two years in, NEM 3.0 has done exactly what the CPUC designed it to do: it shifted the economics from "export as much as possible" to "use what you produce." For homeowners who designed around that shift — with a battery, smart TOU scheduling, and an honest look at their daily usage — solar is still a solid long-term investment.
For homeowners who installed solar-only under NEM 3.0 and are seeing 30–40% lower savings than expected, the fix usually isn't a bigger system. It's adding storage and rethinking when load hits the grid.
Back to those contractors who called me in April 2023: the ones who adapted their system design to NEM 3.0 are doing well. They're selling batteries alongside panels, they're asking about usage patterns before sizing anything, and their customers' NEM 3.0 California solar bills are reflecting that approach. The ones who kept selling the same way are dealing with disappointed customers who feel like the math was misrepresented to them.
Solar isn't dead. But the era of set-it-and-forget-it exports is over.
Three steps if you're considering solar right now:
Pull your last 12 months of utility bills and calculate your average monthly usage and what hours you're actually home.
Ask any installer you meet with to show you the expected bill performance month by month — not just an annual average.
Run the payback comparison with and without a battery before making any final decision.
For a full overview of what the installation process looks like from start to finish, see our Solar Installation Guide in California (2026): Costs and Process.
Related Posts
About the Author
James Ree has eight years of experience in electrical, HVAC, and solar wholesale in Los Angeles, supplying equipment to residential and commercial installers. He now writes practical guides on solar, EV charging, battery storage, and home electrical systems for U.S. homeowners and outdoor enthusiasts.
Disclaimer
Product prices and specifications change frequently. Verify current pricing and specs on manufacturer websites and major retailers before purchasing. Prices listed are 2026 reference ranges and may differ from current retail pricing.